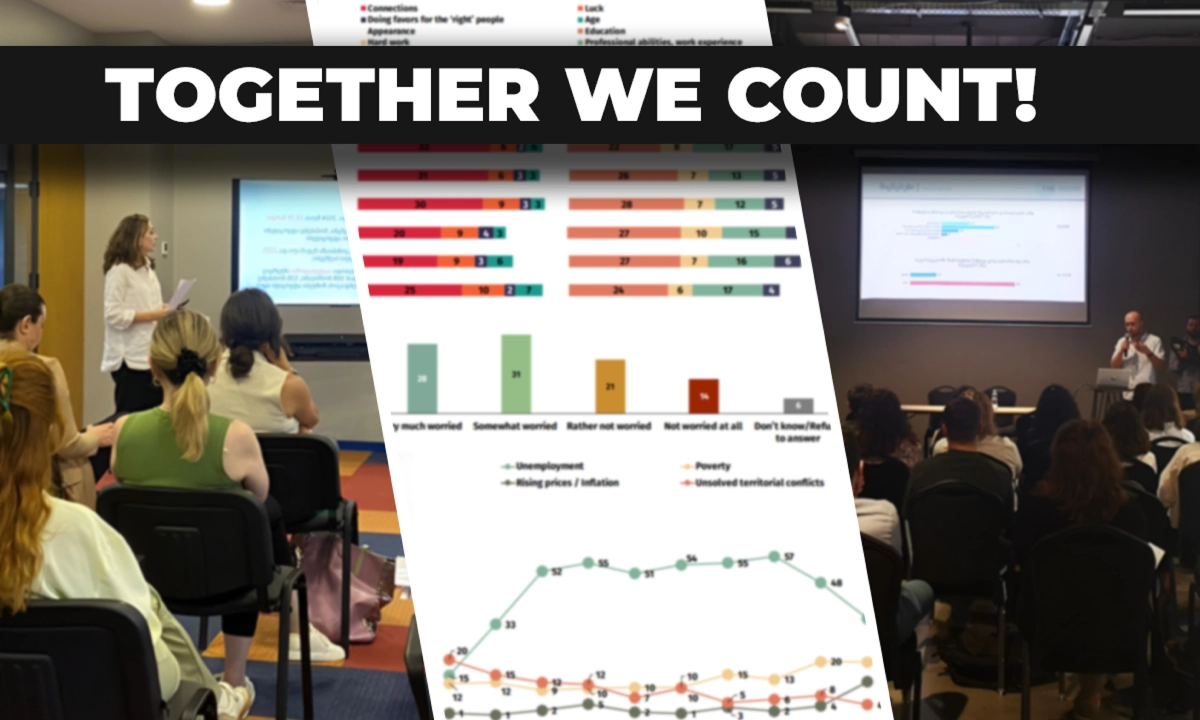
For 20 years, the Caucasus Barometer has tracked what Georgians think. Now, lack of funding threatens the 2026 survey, risking the loss of Georgia's most reliable, independent longitudinal data. We must save it.
Support & share: https://gogetfunding.com/democracy-needs-data-keep-the-caucasus-barometer-georgia-alive
თითქმის ოცი წელია, "კავკასიის ბარომეტრი" გვაჩვენებს, რას ფიქრობენ საქართველოს მოქალაქეები. დღეს, დაფინანსების გარეშე 2026 წლის გამოკითხვა შესაძლოა, ვერ შედგეს და რისკის ქვეშ დადგეს საქართველოს ყველაზე სანდო, დამოუკიდებელი და მრავალწლიანი მონაცემები. ჩვენ ის უნდა გადავარჩინოთ.
მხარდაჭერის კამპანია: https://gogetfunding.com/democracy-needs-data-keep-the-caucasus-barometer-georgia-alive